Sunday, September 9, 2012
Sunday, June 3, 2012
Muscat Securities Market - Update

I thought I'd analyze my own market right here in Oman for a change, looking at the MSM (Muscat Securities Market), its clear that that the market is basing. The Arab spring had a strong impact on equities here in Oman, with the market yet to recover from the destabilizing blow. The near absence of IPO's has also taken its toll on the markets as old names struggled to impress.
Looking at the MSM chart, the MSM had a gold cross with the market re-testing the 50 SMA at 5700 and holding backing March. The gold cross still remains in play, however, as I indicated here fear isn't going anywhere anytime soon. I don't expect the MSM to hold the 200 SMA but I do expect it hold above support at the yellow shaded area. This push lower should be a buying opportunity on fundamentally sound stocks. Timing is everything in this game.

Looking at stocks, only one company caught my eye, AACT (Al Anwar Ceramic). Technically, this stock is perfect, it demonstrated relative strength in comparison to the MSM and held its ground by not following the market down. It also formed a beautiful head & shoulders pattern.The stock is also above its 200 and 50 SMA's. Fundamentally, this stock is sound with its current assets double its current liabilities. It almost has no debt and it has a high gross margin. EPS has grown over last year with its P/E being its only dent at 46 times earnings. R.O 370 is the level to watch here, a breakout could see this stock go.
This isn't an invitation to buy or sell, its just my insight into the current situation on equities here in Oman. Information on stocks is very scarce here and unless you have bloomberg, everything has to be done manually though raw data. I would have loved to conduct quantitative studies on the stock but obtaining the data need was impossible. Other stocks worth looking at are OCOI (Oman Cement) and Al Saffa chicken which is up almost 500% since its IPO in 2010. My only issue with Al Saffa is its illiquidity.
To conclude this post, the MSM is still a difficult place to invest. Its nature makes it very volatile, Ill leave the reasons to another day.
Monday's Gameplan (3/6/2012)
From time to time, I intend on posting my gameplan here (with charts) with some explanation of my daily gameplan. Preparation plays a huge role in my trading, I typically spend hours preparing for the trading day, after all, luck favors the prepared. I am competing against the sharpest minds in the world on a daily basis, being second best means loosing money and you wont be the best unless you prepare with the will to win.
I have several charts below, all being stocks. If we get a lower open on Monday which is likely, one of three things will happen, we rally (30% probability) or head lower sharply due to fear (60% probability) we go no where (10% probability). I have selected my stocks to prepare myself for any outcome. If we open lower and rally, I have X which I intend on being long for the day. If we decline sharply I have a bunch of stocks on my radar, mainly being LEN, BHI, MOS, AKAM and FDX. Panic is right around the corner, things could get very volatile and to prepare myself for the volatility, I have adjusted my position sizing to handle the heat. I wont push my luck on Monday, things could get really whacky in this environment. Flexibility is key.


Saturday, June 2, 2012
Watch for avalanche of sell orders Monday - Panic - MarketWatch
Watch for avalanche of sell orders Monday - The Tell - MarketWatch - In other words let the panic begin
Friday, June 1, 2012
7 Charts on Panic
I believe that the market might be set for one more push down. Investor sentiment has moved from various stages the last being panic, we started with:
Euphoria: Record US corporation earnings and the super Apple along with a Fed that wouldn't allow the markets to go down due to their printing press also known as quantitative easing.
Anxiety: Europe and Greece's problem looming in the background along with signs that the global economy was slowing down.
Fear: The fear of a default in Greece with the government failing to reach a solution. Chinese economic slowdown sending AUD/USD south along with gold.
Desperation: Turmoil in Europe, with the markets pricing in a a Greek default along with strength seen in the USD and Treasuries along with the Bund as investors look for a place to park their cash. Oil also falling like a falling knife as investors price in the global economic slowdown on the demand for oil.
Panic: This will be the final push down that should cause capitulation among investors. I have various charts explaining the possibility of this occurring:


The charts above demonstrate the likelihood of a market low. Of course the market always has the potential to go lower, however, that shouldn't stop us from looking at what's happening along with setting scenarios at various market stages. A breach of the support levels listed above and failure to hold above them could cause things to get ugly, however I see that scenario as unlikely especially given the relative strength in Chinese equities along with the expectation that officials wont allow for such a crash to occur by intervening in Europe. That being said, the only thing we know for sure is that anything can happen.
Euphoria: Record US corporation earnings and the super Apple along with a Fed that wouldn't allow the markets to go down due to their printing press also known as quantitative easing.
Anxiety: Europe and Greece's problem looming in the background along with signs that the global economy was slowing down.
Fear: The fear of a default in Greece with the government failing to reach a solution. Chinese economic slowdown sending AUD/USD south along with gold.
Desperation: Turmoil in Europe, with the markets pricing in a a Greek default along with strength seen in the USD and Treasuries along with the Bund as investors look for a place to park their cash. Oil also falling like a falling knife as investors price in the global economic slowdown on the demand for oil.
Panic: This will be the final push down that should cause capitulation among investors. I have various charts explaining the possibility of this occurring:
On currencies


On Credit

On Volatility

On Commodities


On Equities

The charts above demonstrate the likelihood of a market low. Of course the market always has the potential to go lower, however, that shouldn't stop us from looking at what's happening along with setting scenarios at various market stages. A breach of the support levels listed above and failure to hold above them could cause things to get ugly, however I see that scenario as unlikely especially given the relative strength in Chinese equities along with the expectation that officials wont allow for such a crash to occur by intervening in Europe. That being said, the only thing we know for sure is that anything can happen.
Tuesday, May 29, 2012

Saturday, May 26, 2012
7 Interesting Charts for Tuesday

XLK: Very nice consolidation pattern with a nice inside day forming on Friday. look for volatility above or below the inside day.

XIV: Like the XLK, the XIV wants to explode on Monday, an inside day after consolidation right below a clear support level could send this stock in either direction.

TLT: Another consolidation pattern being a flag followed by a tight inside day right below resistance at 124.50. I will be watching this one closely because as explained here, a breakout in the TLT could have serious implications.

DXY0: Has already taken out resistance a couple of days ago. This is a huge warning sign that dollar strength is underway and that things could head south soon.

HYG: High Yield Corporate Credit had broken down and is now holding below support. Friday was the biggest tell-tale sign that this instrument will likely head south with a close below the 200 SMA. Its next target is the low of the swing low at 87.50, should that level be taken out then there lots of room to the downside.

SPY: Broke its downtrend (blue line) but failed to make any serious short covering rally. At this point this consolidation int the SPY can't be considered a bottom, the moving averages are yet to catch up to the move due to the severe breakdown that occurred. This move looks more like a bearish flag at this point with more down side to come with the next major hurdle being the 200 SMA.

SSEC-X: That Shanghai Index has been monitored closely ever since it broke its downward trendline and entered a consolidation/accumulation phase. I am still bullish Chinese equities despite all the negative sentiment concerning Chinese stocks due to its relative strength. Only price pays, everything else is irrelevant and is only a gauge for sentiment. A breakdown from the yellow trendline could be the final push down prior to the mark up.
Friday, May 25, 2012
Bearish Gold

I am watching this closely, a breach of $ 1525 could trigger a breakdown in gold with a move all the way down to $1100. At the end of the day, only price pays.
Monday, May 21, 2012
Risk Off (DXY0 & TLT)


Here I have 2 charts, the first being the USD index DXY0 and the second being the TLT US treasuries ETF. Both charts are on the verge of a breakout which could have severe bearish risk off implications. Ignoring these signs would be dangerous. If they breakout and hold, I suggest getting into cash until things calm down. A breakout and failure to hold above resistance with price coming back into the range would be bullish.
Update: (23/5/2012)
P.S. I am still watching the USD along with the US treasuries closely. If we get a crisis in Europe we are probably going to get a run on banks. This money will most probably be stored where? Yeah that's right in the in US treasuries and the German Bund (TLT, BUNL).
P.S.S. Despite the mass media talking about the market being at an extreme, the TLT and the DXY0 are at the tip of the iceberg. A breakout above their respective levels could just be the beginning. A pause below resistance however is possible and could happen really soon in order to fuel the breakout.
Sunday, May 20, 2012
AUD/USD
Back on 27/1/2012 I wrote the following:
"Ray Dalio is bearish AUD/USD along with other emerging currencies...Why? Below are some thoughts:
1) If Ray thinks the AUD will go down along with other emerging nations, he probably believes China will go through a hard landing.
2) If China go into recession, demand for metals will go down sending the AUD/USD down.
3) China is also the 2nd country after the USA in terms of GDP, should their demand for metals go down then that should affect the currencies of other emerging countries whose exports to China would fall hence sending their currencies down; it’s a game of supply and demand.
4) EUR going into a recession might not affect the US much but China would definitely feel some pain.
5) AUD/USD is a pair that is extremely sensitive to news from China. AUD/USD is also a pair that reflects global equities health, should the pair crash then that shouldn't be too positive for global equities.
6) Technically, the AUD/USD is in a weekly distribution base. A breakdown could cause mayhem.
7) This will especially have adverse effects on steel and basic materials which is already lagging (SPY/XME).
P.S. Bridgewater is also bullish gold which is pretty obvious with all the central banks printing, he sees inflation thus buying gold as a hedge."
Its now time to review what happened though these two weekly charts of the AUD/USD and the XME.


Now statistically speaking, the AUD is overpriced when compared with the USD. To conduct the quantitative study, I took the USD ETF (UUP) and the AUD ETF (FXA). The correlation between the two is -89%. The average spread of the two currencies over the past 5 years has been -9.14 with the spread currently being at 8.45 (FXA being overpriced). At the time my article was written the spread was at ~20 at 1.5 standard deviation. A revert back to the mean is to be expected with a cointegration taking place.


It will be very interesting to see how these two instruments play out over the coming months especially given the current bearish outlook on the global economy.
Thursday, May 17, 2012
Key Inflection Levels Part 2 (GLD, OIH, UUP, TLT, UUP)
Well lets see what happened after I wrote the last post, did the market act as an inflection point? Well lets just find out.

GLD: Continued to get to weaken as the spread approached .90 which should act as short term resistance.

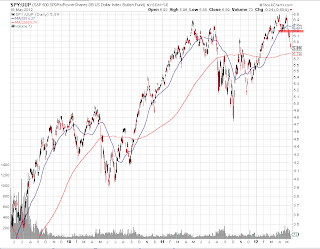
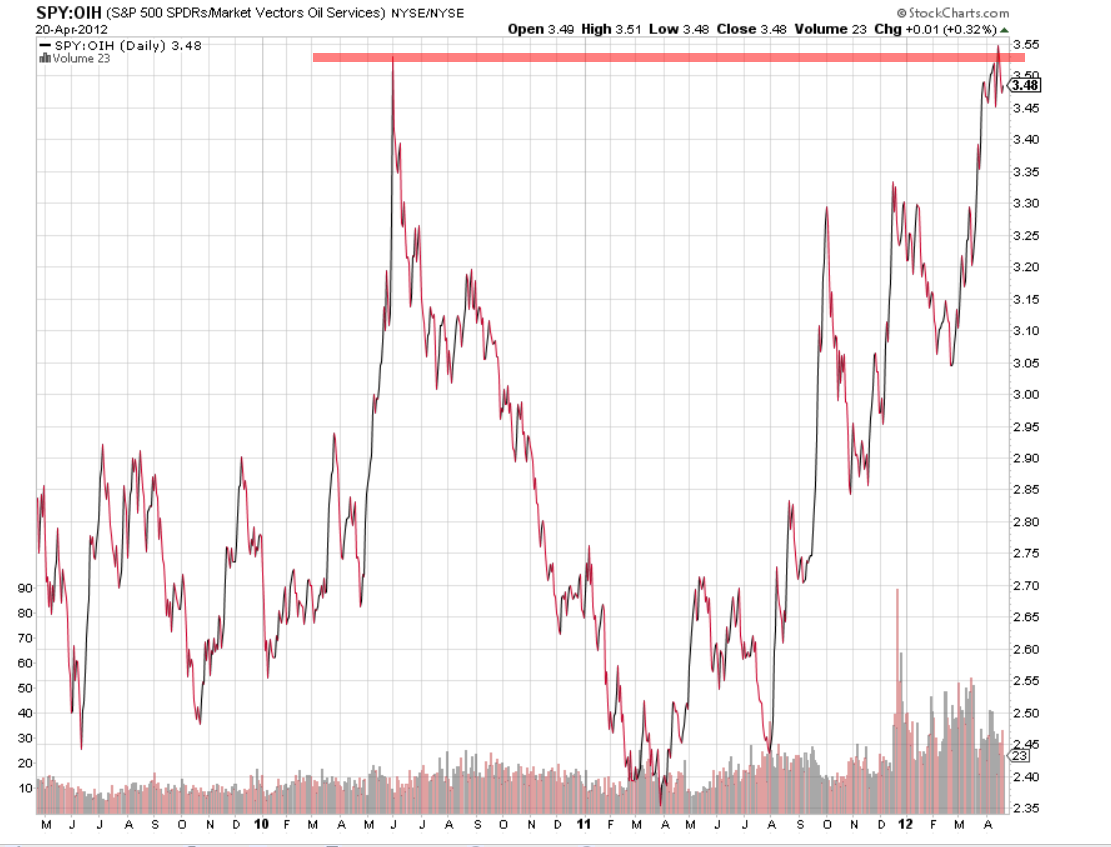
OIH: Clear breach or resistance reflecting oil's current weakness.
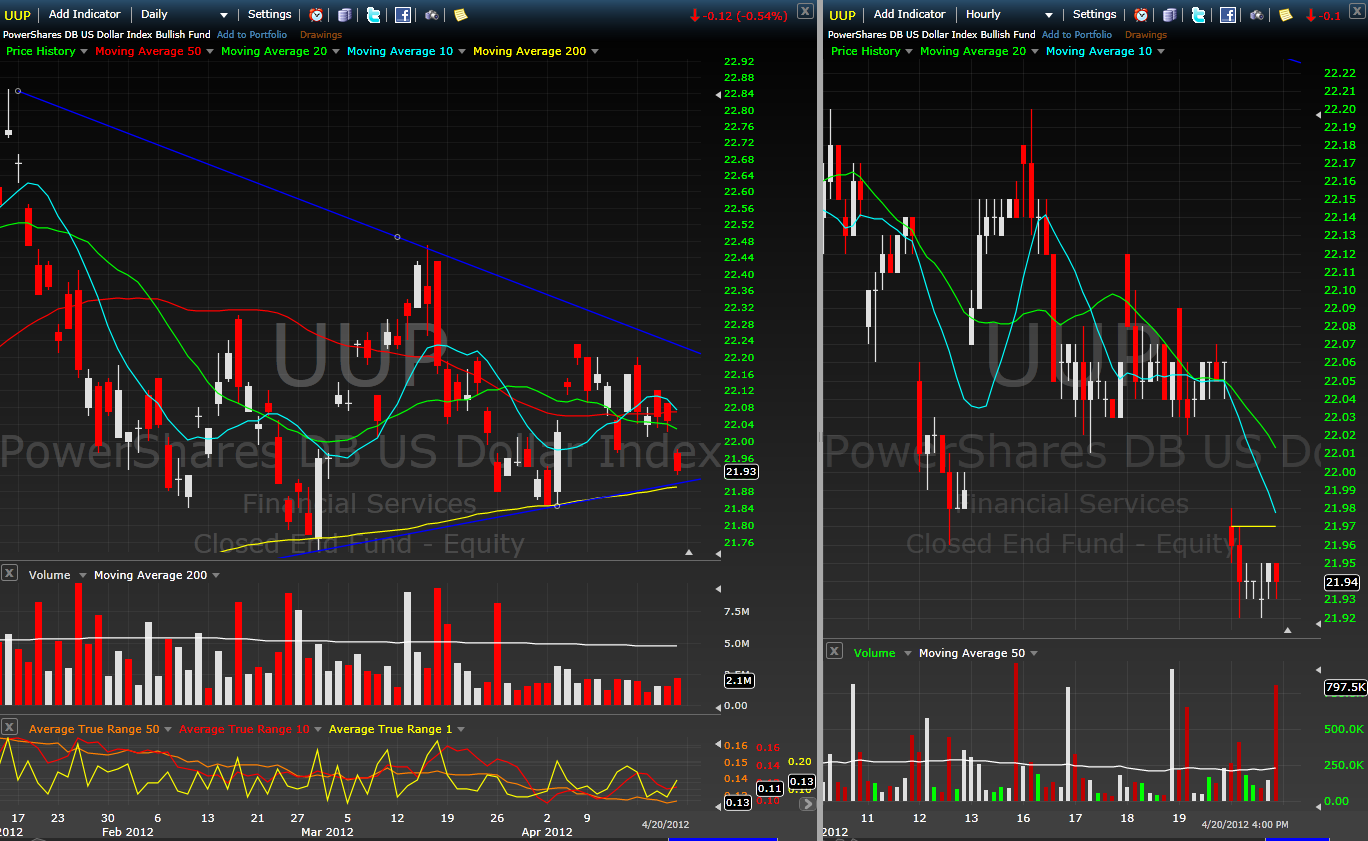
UUP: After that diagnol trendline broke, all hell broke loose as the dollar gained strength and outperformed equities.

TLT: Price should have held that 1.150 but obviously didn't and that resulted in a breakdown. This is a tough one to predict, I have no clue where its headed.
It will be interesting to see how things develop from here.

GLD: Continued to get to weaken as the spread approached .90 which should act as short term resistance.

OIH: Clear breach or resistance reflecting oil's current weakness.

UUP: After that diagnol trendline broke, all hell broke loose as the dollar gained strength and outperformed equities.

TLT: Price should have held that 1.150 but obviously didn't and that resulted in a breakdown. This is a tough one to predict, I have no clue where its headed.
It will be interesting to see how things develop from here.
Thursday, May 3, 2012
Shanghai Index Update

This thing just took out the 200 SMA and is now testing 2,450. A breakout here could trigger more buying sending this thing to 2,500 at least. I am becoming more bullish on Chinese equities.
Saturday, April 28, 2012
Mondays Gameplan
Longs: ESRX (55.00),
Breakouts: WDC<37.00, KLAC<51.25, POT<42.25, CREE>31.25, M>41.25,
Volatility: SLW (30.50 30.00),
Shorts: JCP (37.00), A (42.75), PCAR (42.75), MCD (97.50), SWN (30.50),
Breakouts: WDC<37.00, KLAC<51.25, POT<42.25, CREE>31.25, M>41.25,
Volatility: SLW (30.50 30.00),
Shorts: JCP (37.00), A (42.75), PCAR (42.75), MCD (97.50), SWN (30.50),
Wednesday, April 25, 2012
Wednesdays Gameplan
Longs: COST (86.00), TJX (40.00), KLAC (51.25), COH (SDP).
Breakouts: LEN<24.50, ko>74.50, TGT<56.25, M<38.50, POT<42.50, TIF<65.50
Volatility: CREE (30.00 29.40), SLW (28.85, 28.25), SNDK (36.65, 36.25)
Shorts: BAX (55.00), TRV (64.00), XOM (86.50)
Notes:
Today is the Fed day, I will likely do nothing until we have that clear.
Breakouts: LEN<24.50, ko>74.50, TGT<56.25, M<38.50, POT<42.50, TIF<65.50
Volatility: CREE (30.00 29.40), SLW (28.85, 28.25), SNDK (36.65, 36.25)
Shorts: BAX (55.00), TRV (64.00), XOM (86.50)
Notes:
Today is the Fed day, I will likely do nothing until we have that clear.
Tuesday, April 24, 2012
Tuesdays Gameplan
Longs: JNPR (20.00),
Breakouts: AKAM>39.00, XOM>86.00, TIF>67.50, UNH>59.50, KO>74.25, TGT<56.20, POT<42.50, LEN<24.50,
Volatility: YUM (73.85 72.85), MCD (96.00 94.85),
Notes:
JNPR 4 down days in a row.
SPY key level (135.75) , IWM (78.00),
Breakouts: AKAM>39.00, XOM>86.00, TIF>67.50, UNH>59.50, KO>74.25, TGT<56.20, POT<42.50, LEN<24.50,
Volatility: YUM (73.85 72.85), MCD (96.00 94.85),
Notes:
JNPR 4 down days in a row.
SPY key level (135.75) , IWM (78.00),
Saturday, April 21, 2012
Key Inflection Levels (GLD, OIH, UUP, TLT, UUP)
Market at key inflection levels. Heres a few charts for you to decide for yourself the upcoming market direction.
SPY vs GLD


SPY vs OIH

SPY vs UUP

SPY vs TLT


Shanghai Index Update

Following on my previous Shanghai Index, the index has continued to outperform to the upside. I remain bullish on Chinese equities and the next line in the sand to watch would be the previous high at 2480. The index has move 50 points since I last wrote about it when it was at 2359.
Mondays Gameplan
Longs: SNDK (SDP), C (33.80), BRCM (34.50), MCP (29.50), M (38.80), AKAM (37.00), FCX (37.50)
Breakouts: MS<17.20, BBY<21.25, JCP<33.00, KO>74.50, A<41.75
Volatility: BAX (54.75 53.75), SBUX (60.00 59.00), CREE (30.80 30.00), TIF (67.50 65.50)
Shorts: ALTR (SDP), DOW (35.50)
Notes:
I have a ton of setups for Monday, should be careful to NOT overtrade and be as selective as possible.
GLD set to explode (160.00 159.00). GDX heading south.
Very obvious upthrust in OIH and XLE.
QQQ & AAPL look like they want to saturate.
Shanghai Composite still rallying after I wrote this.
IYR about to breakout (XHB).
UUP<21.90 is bearish for the dollar and bullish for stocks.
TLT>117.50 is bullish treasuries.
Friday, April 20, 2012
Fridays Gameplan
Longs: TRV (SDP), UNH (SDP),
Breakouts: MS<17.30, WDC>43.00, POT<42.50, JPM<42.75, NEM<47.50, BAX<54.00, TIF<65.75, A<41.75, TGT<56.25, JNPR<20.80, NVLS<46.00, LEN<24.50
Volatility: MOS (51.00 50.00)
Notes:
Options expiry.
Breakouts: MS<17.30, WDC>43.00, POT<42.50, JPM<42.75, NEM<47.50, BAX<54.00, TIF<65.75, A<41.75, TGT<56.25, JNPR<20.80, NVLS<46.00, LEN<24.50
Volatility: MOS (51.00 50.00)
Notes:
Options expiry.
Thursday, April 19, 2012
Thursdays Gameplan
Breakouts: CVX>104.00, DD>53.75, ABX<40.75, X>29.50, MS<17.25, JPM<42.75, GG<40.50, MCP<31.75,
Volatility: KSS (R=51.50 S=51.00), HON (R=59.00 S=58.25), MOS (R=51.00 S=50.25), A (R=42.75 S=42.00), NTAP (R=40.50 S=39.75) , SWN (R= 28.30 S=27.90)
Shorts: XOM (86.00)
Notes:
UUP consolidating, FXE poised for a breakdown below 129.50, TLT key level 117.50 any breakout could signal higher prices, GDX holding below its broken trendline, SPY in the middle of nowhere.
Wednesday, April 18, 2012
Wednesdays Gameplan
Longs: SBUX (58.50)
Breakouts:CREE>32.50, FCX>38.00, KO>74.25, MCP>31.30, DD>54.00, NEN<48.00
Volatility: COP (R=74.75 S=74.25) BBY (R=22.00 S=21.75)
Shorts: XOM (85.50), UAL (22.75)
Breakouts:CREE>32.50, FCX>38.00, KO>74.25, MCP>31.30, DD>54.00, NEN<48.00
Volatility: COP (R=74.75 S=74.25) BBY (R=22.00 S=21.75)
Shorts: XOM (85.50), UAL (22.75)
Tuesday, April 17, 2012
Tuesdays Gameplan
Longs: mcd (96.00), wlp (68.50),hal (32.00), vlo (23.25), nvls (47.00)
Breakouts: ms<12.25, jpm<42.75, pot<42.50, fdx<87.75, coh<73.00, a<41.75, cree>32.50
Breakouts: ms<12.25, jpm<42.75, pot<42.50, fdx<87.75, coh<73.00, a<41.75, cree>32.50
Sunday, April 15, 2012
A Warning Sign in Gold (GLD)

A death cross is about to form in the GLD, I dont trade this signal exclusively but I never the less watch it. Thing's could get ugly if it follows through for the bulls. A death cross occurs when the long term moving average typically the 200 SMA crosses the short term moving average which is typically the 50 SMA.
Saturday, April 14, 2012
Shanghai Index
Meanwhile, as the SPY begins to enter a consolidation phase, chinese equities are begining to look interesting. Especially after the positive fundamentals coming out of there after the chinese stimulus started to kick into gear.
Technically, the weekly trendline was broken and was perfectly tested. A move above 2,500 could signal the begining of a bull market in chinese equities. I will be following this very closely from here on.

The FXI (Chinese ETF) has also outperformed all other major global markets last week which is another sign that things aren't as bad as some people think. As always, wait for confirmation, I wont get bullish until 2500 is breached.

Technology Sector Update (QQQ, AAPL, SNDK & A)


The trend is your friend, until it bends. The tech sector has already bended, as shown by QQQ (The Nasdaq ETF), which is considered to be a good indicator of the technology sector. This was confirmed by non-other than the mammoth AAPL (Apple), which bended and broke its trend line on above average volume.
Should Apple sell off, panic should creep into the sector but I expect buying to come back in at some point. This should mark the beginning of a consolidation phase. Choppy price action is to be expected, a full blown reversal in price is unlikely.
The warning signs to AAPL and the tech sector came in a while ago, after SNDK (Sandisk) crashed down with a massive gap to trade below its 200 SMA and break below resistance, the news release that triggered this selling can be found here. This gap was followed by selling which sent the stock another $5 down. Again, this was just a warning sign, not an invitation to sell, the stock is bound to bounce sooner rather than later. If you caught the move when it broke below its 200 SMA and resistance, well done!
One of the stocks on my radar for this move is A (Agilent Technologies), I am waiting for a breakdown below support, the same level has been tested 4 times, a breakdown at this point seem to be imminent with a lot of room to go, the next support level is at 40.50, then at 39.00 where the 200 SMA resides.
Again, this isn't an invitation to sell, selling short is a difficult game to master, short covering rallies take out even the best traders due to the short reversal nature of the move. Moves down don't go smoothly, their usually highly intense bumpy moves. That’s where position sizing comes into play, you have to size it appropriately as to not get shaken out.
Subscribe to:
Posts (Atom)